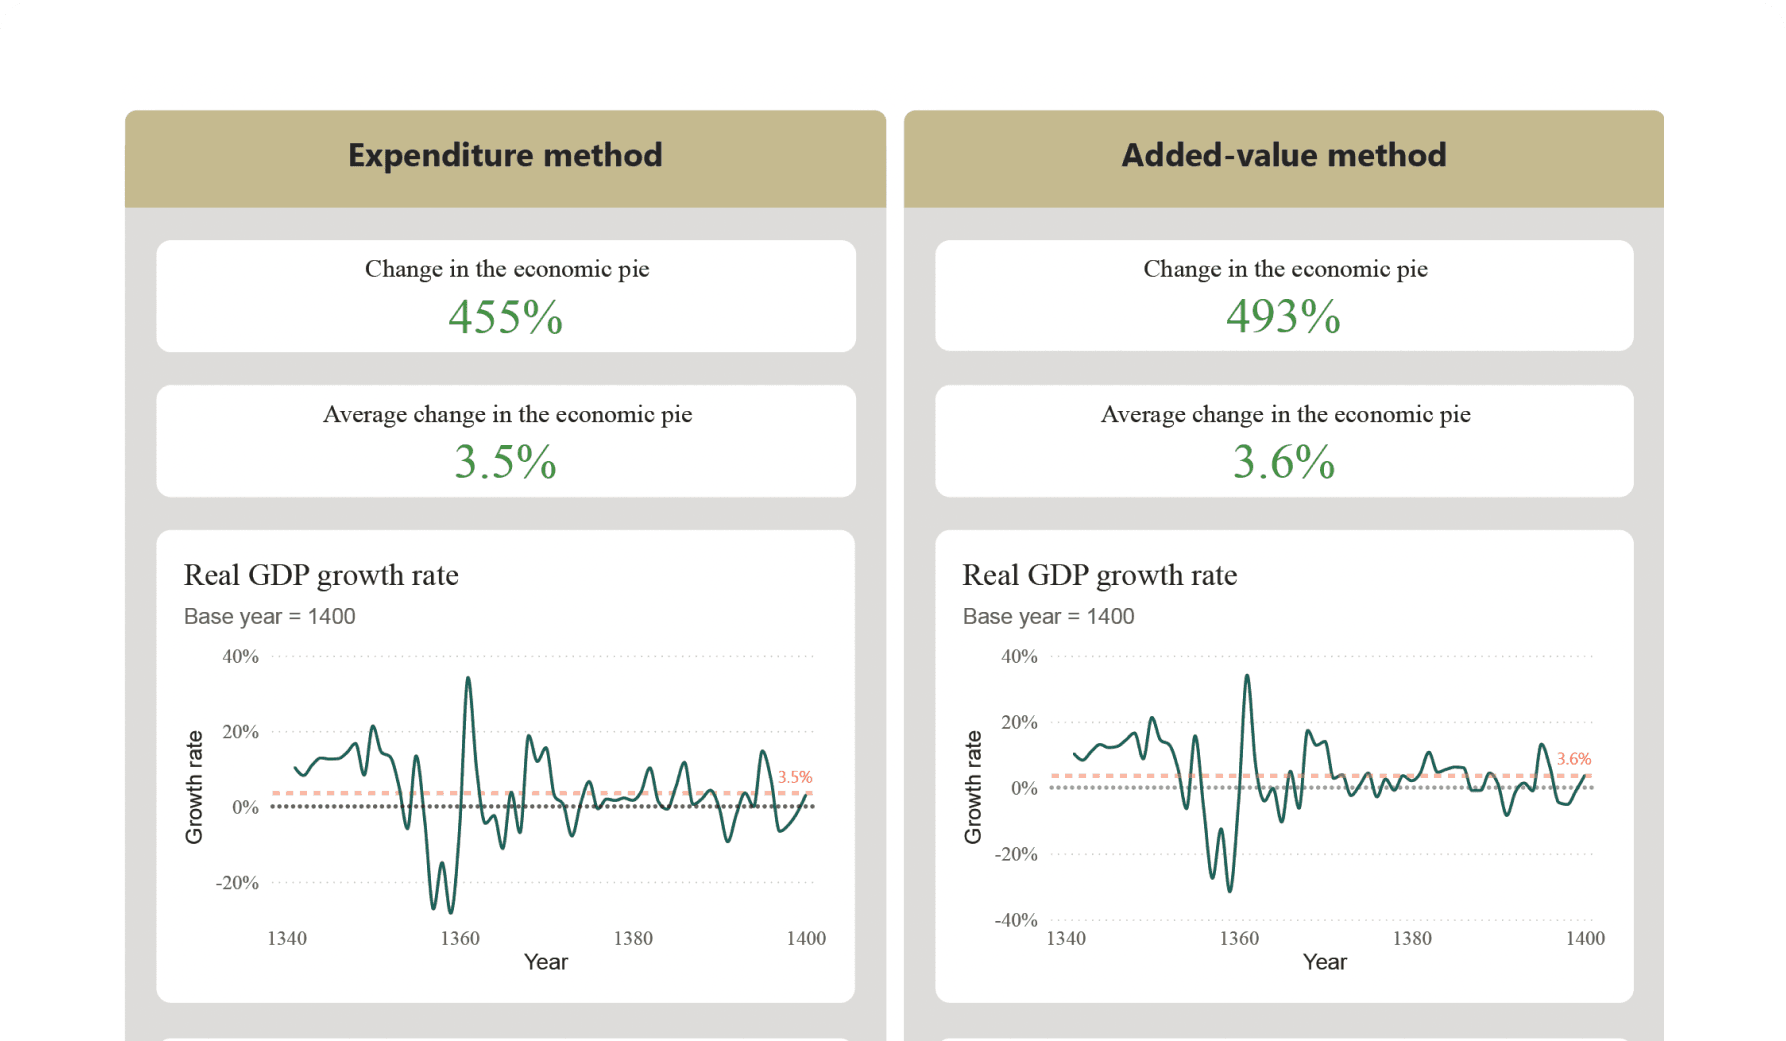
Real GDP trend by
added value
added value
If you run a business, Datalks lets you upload your data and blend it with base stats like population or exchange rates to hear your business’s story.
Real GDP trend by
expenditure
expenditure
Real GDP trend by
added value
added value

2006
2011
2016
2021
Latest charts
01/04
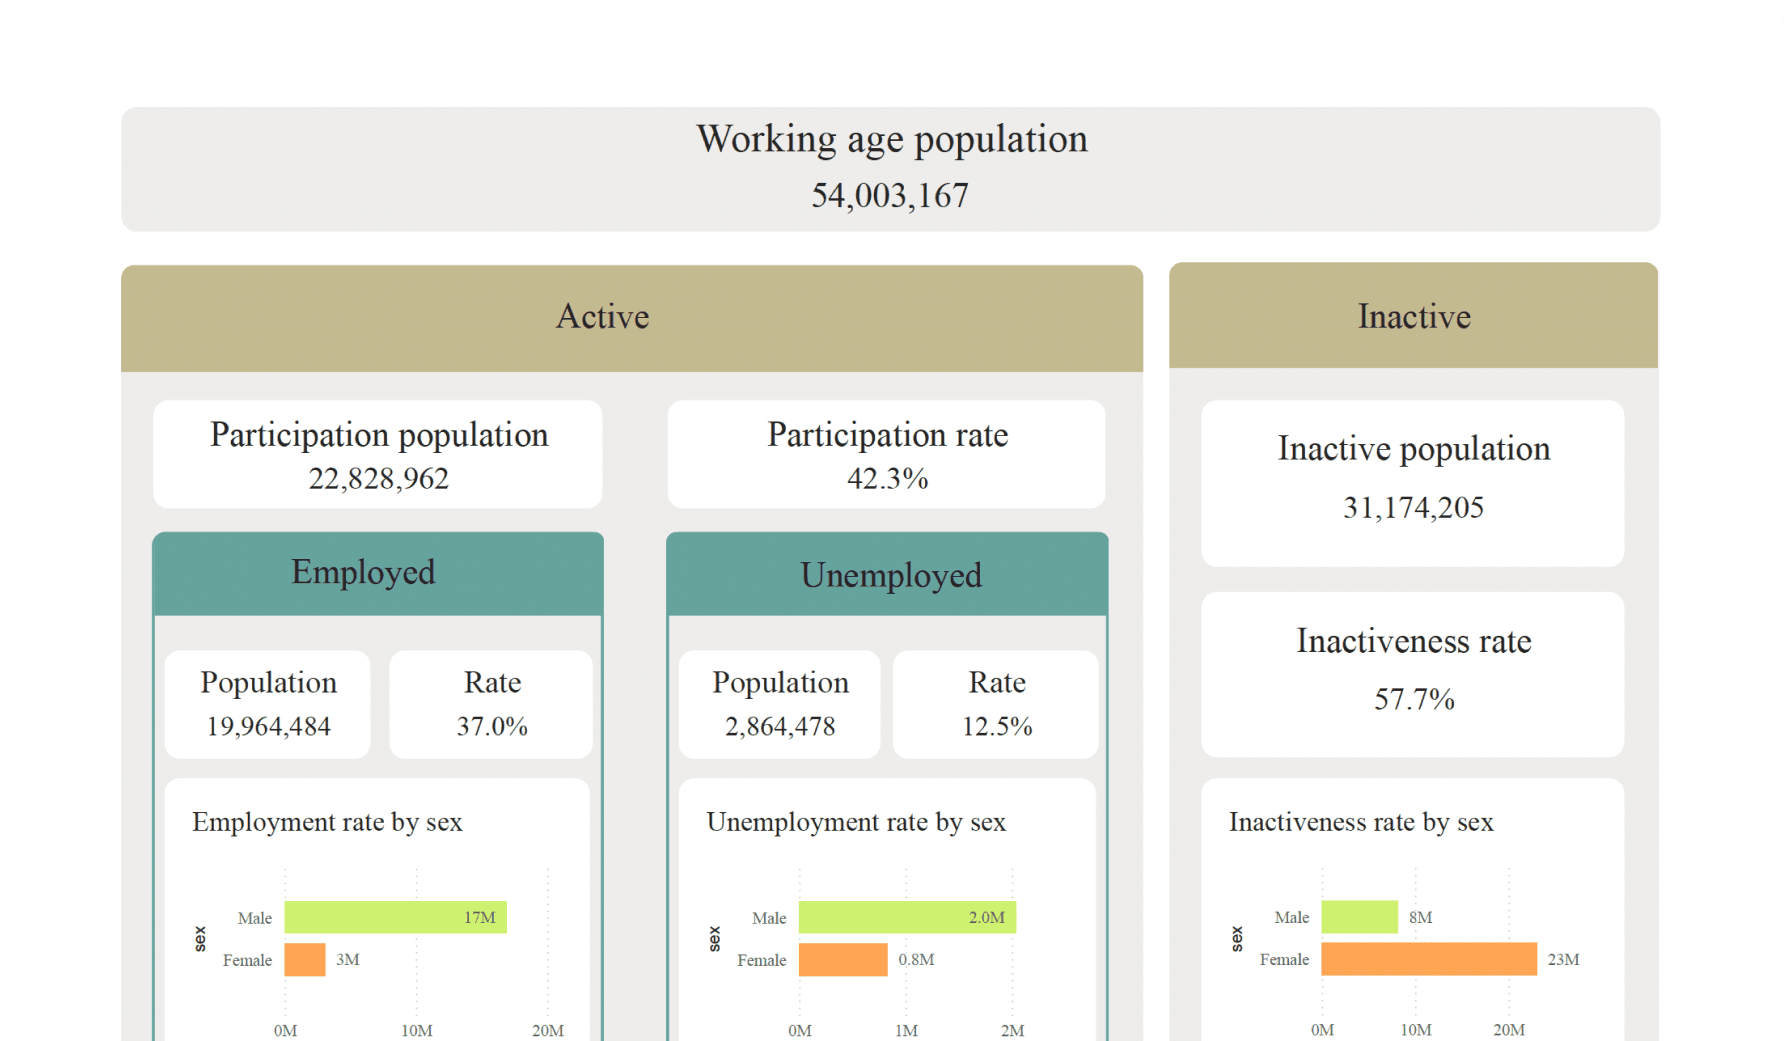
See all charts Iran LFS - Gender
Based on the latest labor force data, Iran's participation rate stands at 42.3%, with an active population of nearly 22.8 million and an inactive population of over 31.1 million (57.7%). Of the active population, 87.5% are employed while 12.5%—approximately 2.86 million people—are unemployed, with unemployment affecting women more severely. Employment is predominantly male and urban (61%), while inactivity is highest among urban women (55%). Provincial maps show regional disparities, with central and western provinces facing higher unemployment and inactivity rates, highlighting structural imbalances in labor market access and gender-based participation.
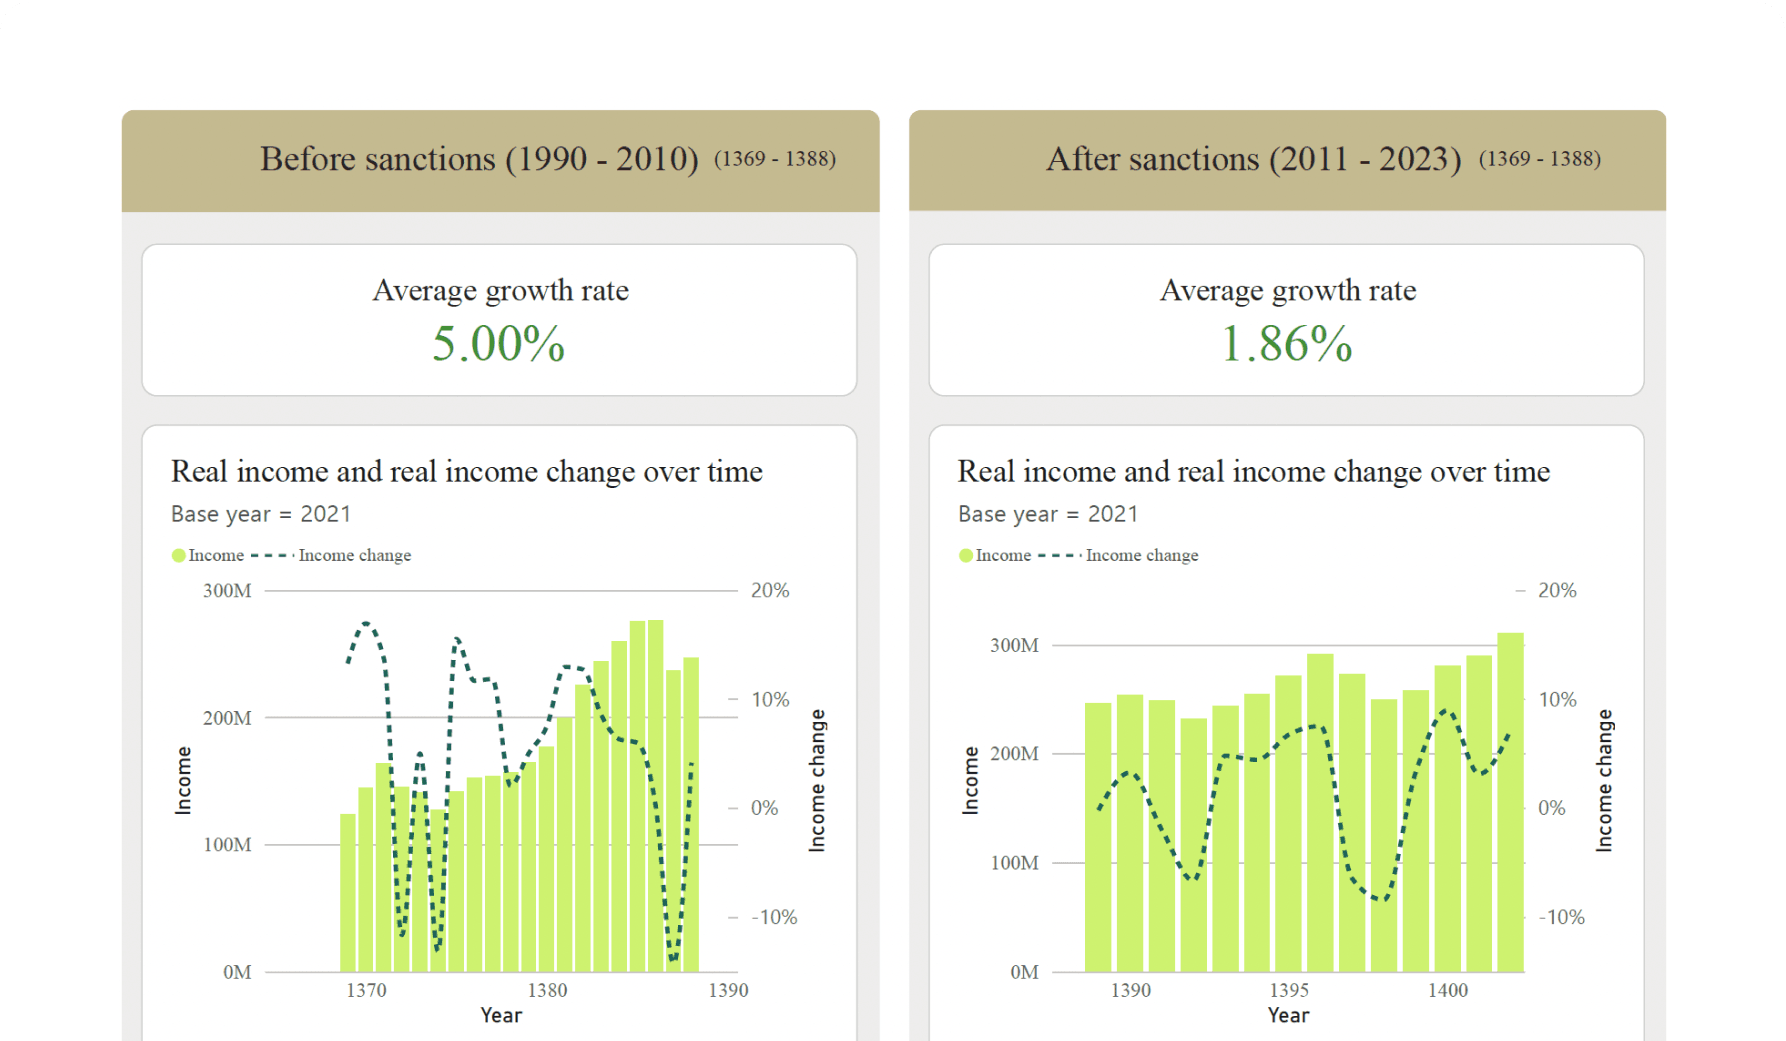
Iran IHBS - Sanction Impacts
Before sanctions, it was a golden time, with growth blooming at 3.70%. Red bars rise from the 1970s, and a wavy blue line dances along, showing a land full of promise. The map glows green, with every province like Tehran and Khuzestan adding its own vibrant chapter.
Then, in 2011, sanctions brought a challenge, slowing growth to -0.42%. The red bars wobble, and the blue line dips, telling a tale of struggle. The map shifts, bright reds flare in the west where it’s toughest, while soft greens hold on in the east. It’s a gripping story of Iran’s economic heart beating through every twist!
Iran IHBS - Nominal Expenditure
This page shares data from the Iran Household Budget Survey, showing household nominal expenditures across provinces. It offers a snapshot for a specific year, comparing spending patterns between rural and urban areas to reveal regional differences.
The monthly nominal expenditure hits 152.64 million, setting the scene for a big adventure. Watch it jump by 47% yearly, like a sudden market boom!
Urban areas lead with 152.64 million in spending, while rural zones sit at 0.44 million, shown with bright orange and teal bars. A dotted line at 45% shows the average change. On the map, Tehran shines in deep red as a spending hotspot, while other provinces glow in lighter shades.
Tehran tops the chart at 152.64 million with a 0.45% change, followed by Khuzestan and Isfahan. East Azerbaijan stays lower, and a dotted line at 0.45% guides you through the ups and downs.
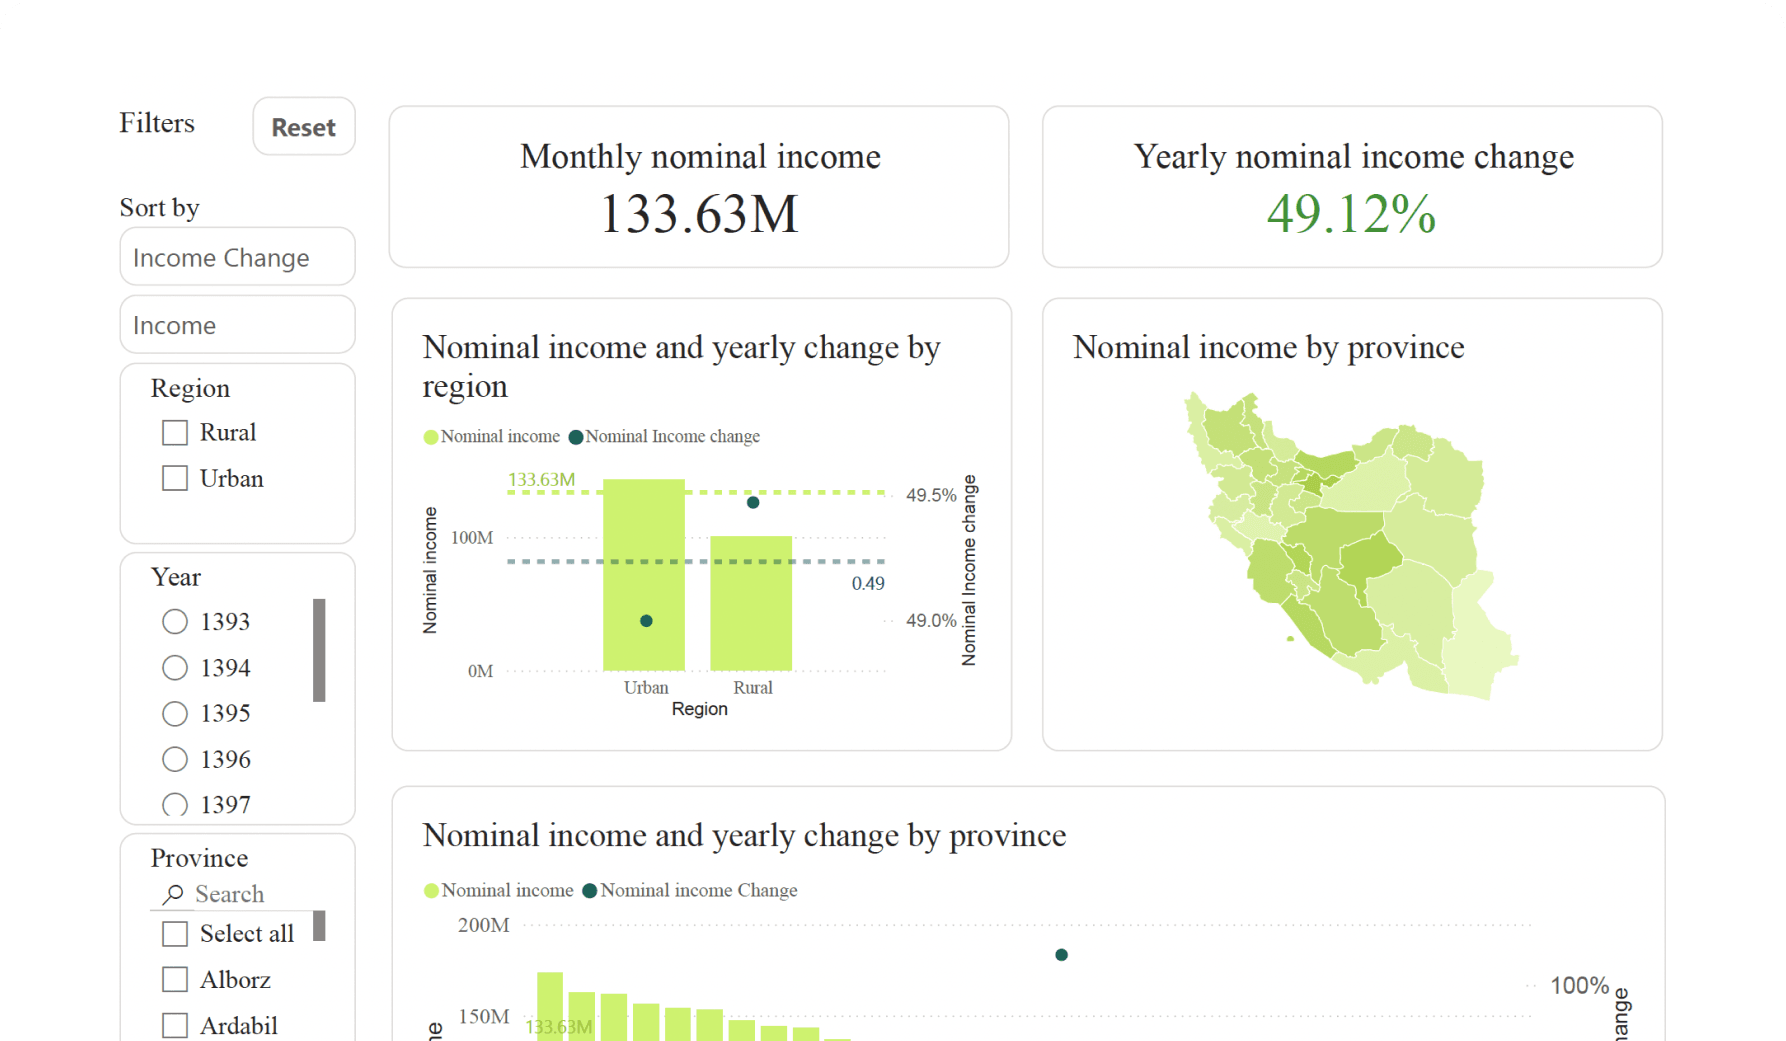
Iran IHBS - Nominal Income
This page presents key findings from the Iran Household Budget Survey, focusing on nominal income trends across rural and urban households. It highlights income patterns by province, offering a clear snapshot of how earnings vary across the country.
In 1402, the average monthly nominal income reached 133.63 million rials, reflecting a 49.12% annual increase. While urban households reported higher income levels, rural areas showed a comparable growth rate, pointing to a parallel rise in earnings despite structural differences. At the provincial level, income disparities are evident. Provinces like Tehran, Mazandaran, and Alborz recorded the highest nominal incomes, while others such as Sistan and Baluchestan remained below the national average. However, year-over-year growth varies widely, with some lower-income provinces showing stronger momentum.
Why We're Reliable

Professional Team
We're a team of skilled researchers, analysts, and designers with deep knowledge of data and communication. We turn raw information into meaningful insight—carefully, precisely, and with purpose.

Sound Methodology
From data cleaning to final visualization, every step follows a clear and consistent methodology. We rely on best practices to ensure accuracy, clarity, and fairness in how we process and present data.

Open-Source Approach
Our commitment to openness makes our work easy to verify and build upon. With selected datasets, tools, and processes available as open-source, we make our approach as transparent as the data we work with.

Contribute Your Data
If you are a researcher, policymaker or student working with socioeconomic data and open to sharing your insights with the public, we’d love to hear from you. Join Datalks and publish your datasets under your name as part of our open data initiative.